Multiple Choice
The figure given below represents the consumption function of a country. Figure 9.3 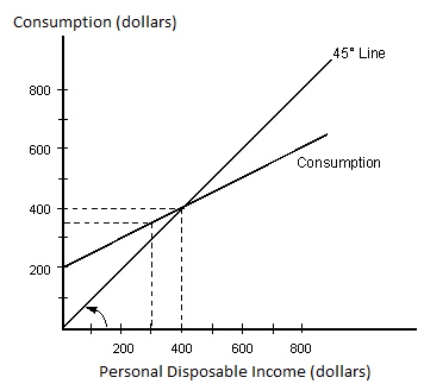 According to Figure 9.3, saving is zero when disposable income is _____.
A) $0
B) $400
C) $250
D) $800
E) $300
Correct Answer:

Verified
Correct Answer:
Verified
Related Questions
Q32: Consumption, saving, and wealth all represent stock
Q33: In the table given below Y represent
Q34: The table given below reports the consumption
Q35: The consumer confidence index can be defined
Q36: Table 9.2 <img src="https://d2lvgg3v3hfg70.cloudfront.net/TB2060/.jpg" alt="Table 9.2
Q38: Other things equal, when the U.S.dollar depreciates,
Q39: Other things equal, a decrease in the
Q40: Which of the following variables do not
Q41: According to the permanent income hypothesis, when
Q42: The part of the disposable income that