Multiple Choice
The figure given below represents the consumption function of a country. Figure 9.3 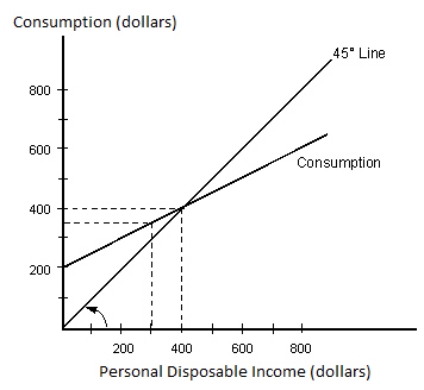 Refer to Figure 9.3.If the marginal propensity to consume is equal to 0.3, then:
A) autonomous consumption would decrease.
B) the total amount of dissaving would increase.
C) consumption spending would equal disposable income at an income level greater than $400.
D) consumption spending would equal disposable income at an income level less than $400.
E) consumption spending would equal disposable income at the same income level of $400.
Correct Answer:

Verified
Correct Answer:
Verified
Q79: Which of the following statements concerning the
Q80: All of the following would cause exports
Q81: The figure given below represents the saving
Q82: Table 9.2 <img src="https://d2lvgg3v3hfg70.cloudfront.net/TB2060/.jpg" alt="Table 9.2
Q83: The figure given below represents the saving
Q85: The net export function is negatively sloped
Q86: Once macroeconomic equilibrium has been established in
Q87: As capacity utilization in an economy rises:<br>A)firms
Q88: Which of the following variables is a
Q89: Identify the correct statement with respect to