Multiple Choice
Each of the panels given below represents the short-run equilibrium in the U.S.economy.The Aggregate Demand and Aggregate Supply curves in each panel responds to various economic changes. Figure 8.1 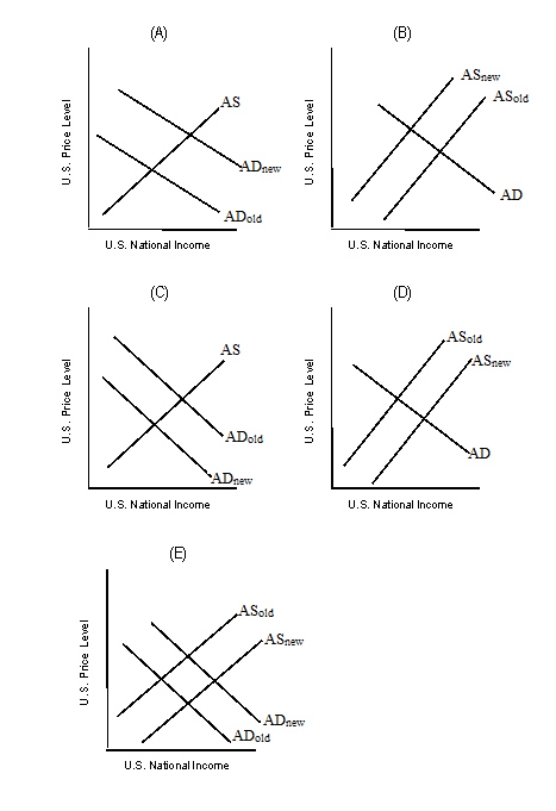 Refer to Figure 8.1.Which of the graphs in the figure best describes the impact of lower real income in Germany on U.S.equilibrium real GDP and the U.S.equilibrium price level?
A) Panel A
B) Panel B
C) Panel C
D) Panel D
E) Panel E
Correct Answer:

Verified
Correct Answer:
Verified
Q106: In the Keynesian case, an increase in
Q107: If the aggregate supply curve is vertical,
Q108: Which of the following is true of
Q109: An increase in aggregate demand due to
Q110: Aggregate demand represents the _ at alternative
Q112: Identify the correct statement.<br>A)Aggregate demand alone determines
Q113: The wealth effect, the interest rate effect,
Q114: In the short-run, an increase in the
Q115: Which of the following explains the effect
Q116: Identify the correct statement.<br>A)Investment is positively related