Multiple Choice
Each of the panels given below represents the short-run equilibrium in the U.S.economy.The Aggregate Demand and Aggregate Supply curves in each panel responds to various economic changes. Figure 8.1 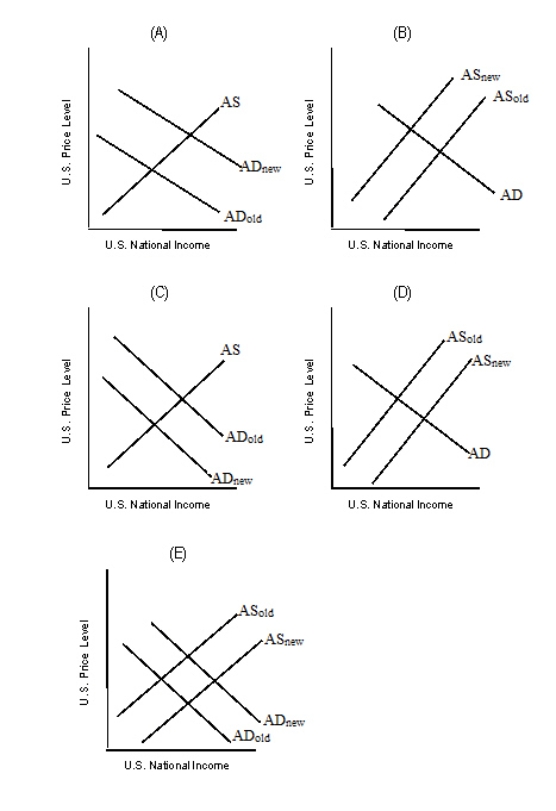 Refer to Figure 8.1.Which of the graphs in the figure best describes the impact of a generalized more optimistic view of the future by consumers?
A) Panel A
B) Panel B
C) Panel C
D) Panel D
E) Panel E
Correct Answer:

Verified
Correct Answer:
Verified
Q100: The table given below reports the inflation
Q101: To determine short-run equilibrium in the economy,
Q102: Assume that the aggregate demand increases while
Q103: The intersection of the aggregate demand and
Q104: Other things equal, an increase in aggregate
Q106: In the Keynesian case, an increase in
Q107: If the aggregate supply curve is vertical,
Q108: Which of the following is true of
Q109: An increase in aggregate demand due to
Q110: Aggregate demand represents the _ at alternative