Multiple Choice
The figure given below represents the equilibrium real GDP and price level in the aggregate demand and aggregate supply model. Figure 8.3 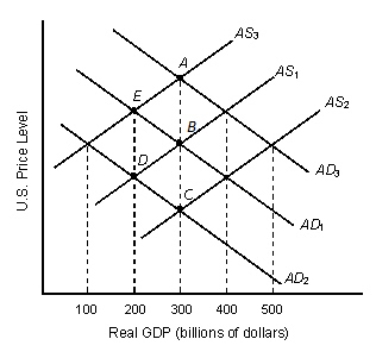 Refer to Figure 8.3.Potential GDP is greater than real GDP at all output levels:
A) above $300 billion.
B) between $300 billion and $400 billion.
C) above $400 billion.
D) below $300 billion.
E) above $500 billion.
Correct Answer:

Verified
Correct Answer:
Verified
Q66: The wealth effect of a change in
Q67: As the level of real GDP increases,
Q68: A demand-pull inflation is caused by an
Q69: Consider the following statement: "If the government
Q70: If the exchange rate is defined as
Q72: A lower domestic price level raises aggregate
Q73: Firms' profits or production do not increase
Q74: If the level of prices falls, the
Q75: A simultaneous increase in both unemployment and
Q76: The table given below reports the inflation