Multiple Choice
The figure given below represents the equilibrium real GDP and price level in the aggregate demand and aggregate supply model. Figure 8.3 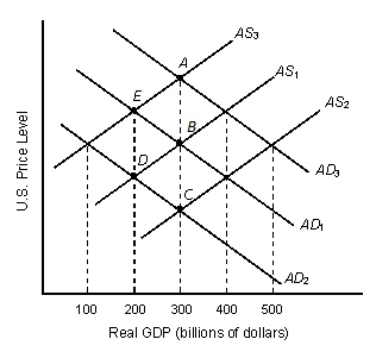 Refer to Figure 8.3.Movement from point B to point D could be initiated by:
A) a stock market crash that undermines consumer confidence.
B) a tax code changes that improve investor expectations.
C) a national emergency that increases government spending.
D) a higher net exports because of economic expansion in European countries.
E) a technological advancement.
Correct Answer:

Verified
Correct Answer:
Verified
Q51: A simultaneous increase in inflation and decrease
Q52: _ is the relation between total expenditures,
Q53: Which of the following does not account
Q54: The aggregate supply curve shows the negative
Q55: The table given below reports the inflation
Q57: The economic reasons that underlie the shape
Q58: If there is a sudden jump in
Q59: The positive slope of the AS curve
Q60: The degree to which _ declines during
Q61: Aggregate demand-aggregate supply analysis shows that in