Multiple Choice
The figure given below represents the equilibrium real GDP and price level in the aggregate demand and aggregate supply model. Figure 8.3 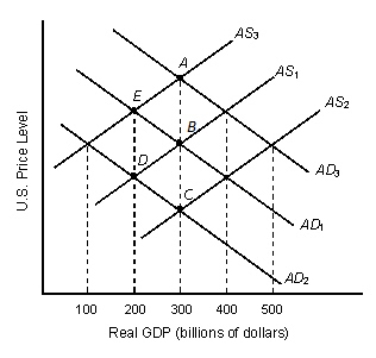 Consider Figure 8.3.Which of the following is most likely to have led to the movement from point B to point E?
A) Declining net exports
B) Increased investment spending.
C) A decline in the domestic price level.
D) An improvement in the quality of labor.
E) An increase in the real wage rates.
Correct Answer:

Verified
Correct Answer:
Verified
Q92: Other things equal, a decrease in government
Q93: A rightward shift in the aggregate supply
Q94: If the national output cannot be increased
Q95: If people expect the economy to do
Q96: Which of the following could lead to
Q98: An increase in the real value of
Q99: Which of the following is true of
Q100: The table given below reports the inflation
Q101: To determine short-run equilibrium in the economy,
Q102: Assume that the aggregate demand increases while