Multiple Choice
The figure given below represents the equilibrium real GDP and price level in the aggregate demand and aggregate supply model. Figure 8.3 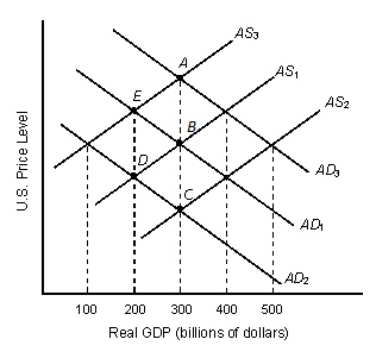 In Figure 8.3, which of the following shifts would result in stagflation (economic stagnation and inflation) ?
A) AS1 to AS2
B) AD1 to AD2
C) AD2 to AD1
D) AD2 toAD3
E) AS1 to AS3
Correct Answer:

Verified
Correct Answer:
Verified
Q36: The change in aggregate expenditures resulting from
Q37: The main reason why the short-run aggregate
Q38: Which of the following is true of
Q39: Pessimistic consumer expectations and decreased government spending
Q40: Which of the following statements is true
Q42: Suppose a representative household holds a bond
Q43: In the short run, a decrease in
Q44: A change in foreign demand does not
Q45: A lower domestic price level tends to:<br>A)reduce
Q46: Other things remaining unchanged, the flatter the