Multiple Choice
Figure 27-1. The figure shows a utility function. 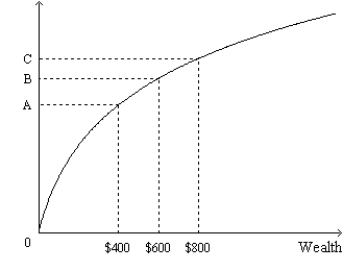
-Refer to Figure 27-1. Let 0A represent the distance between the origin and point A; let AB represent the distance between point A and point B; etc. Which of the following ratios best represents the marginal utility per dollar when wealth increases from $400 to $600?
A) 
B) 
C) 
D) 
Correct Answer:

Verified
Correct Answer:
Verified
Q35: If you are convinced that stock prices
Q59: Laura says that the present value of
Q71: As the number of stocks in a
Q76: Which of the following actions best illustrates
Q99: If you are faced with the choice
Q100: On the Internet you find the following
Q112: Angela reads financial advice columns and concludes
Q135: What is the present value of a
Q150: La Rossa Pasta Company is considering expanding
Q169: Write the formula for finding the future