Multiple Choice
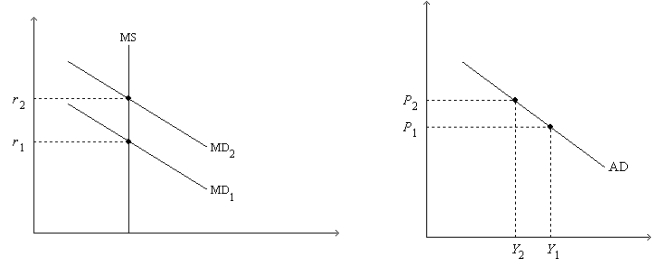
Figure 34-2. On the left-hand graph, MS represents the supply of money and MD represents the demand for money; on the right-hand graph, AD represents aggregate demand. The usual quantities are measured along the axes of both graphs.

-Refer to Figure 34-2. Assume the money market is always in equilibrium. Under the assumptions of the model,
A) the real interest rate is lower at Y2 than it is at Y1.
B) the quantity of money is the same at Y1 as it is at Y2.
C) the price level is lower at r2 than it is at r1.
D) All of the above are correct.
Correct Answer:

Verified
Correct Answer:
Verified
Q4: People are likely to want to hold
Q5: The positive feedback from aggregate demand to
Q22: According to liquidity preference theory,a decrease in
Q27: If,at some interest rate,the quantity of money
Q58: Open-market purchases cause a(n) _ in interest
Q63: When households decide to hold more money,<br>A)interest
Q79: The potential positive feedback that government spending
Q148: In which of the following cases would
Q167: If the Federal Reserve's goal is to
Q348: Figure 34-4. On the figure, MS represents