Multiple Choice
Consider the following data that gives the quantity produced and unit price for three different goods across two different years to answer the next six questions: Assume that the base year is 2012.
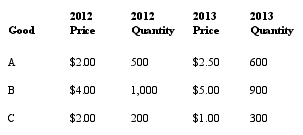
-What was the rate of inflation between the two years?
A) 19.44%
B) 8.57%
C) 6.67%
D) 2.38%
E) 16.67%
Correct Answer:

Verified
Correct Answer:
Verified
Q1: A doctor receives $50,000 per month from
Q96: Consider the following figure to answer the
Q125: The difference between nominal GDP and real
Q127: Consider the following data that gives the
Q130: You bought stock in 2010 for $100
Q131: Consider the following data, which shows the
Q132: For the questions that follow, suppose a
Q132: Macroeconomics is the study of:<br>A) individual markets.<br>B)
Q133: Bob sells his car to Stan's Used
Q156: The four major expenditure categories of GDP