Multiple Choice
Consider the following data that gives the quantity produced and unit price for three different goods across two different years to answer the next five questions: Assume that the base year is 2012.
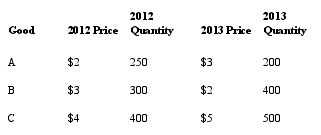
-What was the inflation rate between the two years?
A) 1%
B) 3.2%
C) 2%
D) 3.8%
E) 8.3%
Correct Answer:

Verified
Correct Answer:
Verified
Q62: Explain why intermediate goods and used goods
Q63: Net exports can be defined as<br>A) exports
Q67: Draw a graph to illustrate the phases
Q70: Consider the following data that gives the
Q73: Joe has a full-time construction job and
Q74: The GDP deflator is a measure of:<br>A)
Q80: Nominal GDP is equal to:<br>A) current prices
Q88: Company X sells paper to company Y
Q153: Consider the following data, which shows the
Q186: Nominal GDP increased from $15.62 trillion to