Multiple Choice
The government raises the minimum wage. Which graph reflects this situation? Graph A 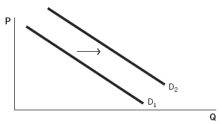 Graph B
 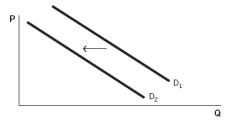 Graph C
 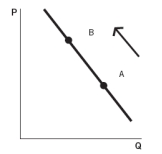 Graph D
 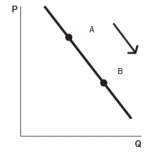 Graph E
A) Graph A
B) Graph B
C) Graph C
D) Graph D
E) Graph E
Correct Answer:

Verified
Correct Answer:
Verified
Related Questions
Q3: As computer usage in companies and in
Q10: Use the following graph,which depicts Mighty Max's
Q12: Refer to the following table to answer
Q46: Refer to the accompanying table to answer
Q59: If more of the production process for
Q62: If the price of pencils falls,the marginal
Q101: You know that the rental price of
Q112: Use the following table,which shows the supply
Q158: Companies outsource their operations because<br>A) the weather
Q161: The following graph represents Zendar's labor market.Use