Essay
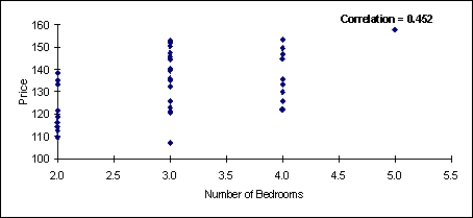
There are two scatterplots shown below.The first chart shows the relationship between the size of the home and the selling price.The second chart examines the relationship between the number of bedrooms in the home and its selling price.Which of these two variables (the size of the home or the number of bedrooms)seems to have the stronger relationship with the home's selling price? Justify your answer. 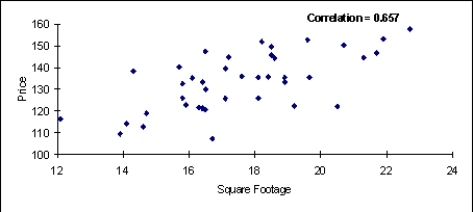
Correct Answer:

Verified
The relationship between selling price a...View Answer
Unlock this answer now
Get Access to more Verified Answers free of charge
Correct Answer:
Verified
View Answer
Unlock this answer now
Get Access to more Verified Answers free of charge
Q2: We must specify appropriate bins for side-by-side
Q30: Approximate the percentage of these Internet users
Q35: Approximate the percentage of these Internet users
Q41: An economic development researcher wants to understand
Q44: If the standard deviation of X is
Q48: How would you characterize the relationship between
Q52: What percentage of these internet users has
Q66: A sample of 30 schools produced the
Q68: To form a scatterplot of X versus
Q203: THE NEXT QUESTIONS ARE BASED ON THE