Multiple Choice
Compared with curve 2 on this hydrograph,what is a possible explanation for curve 1? 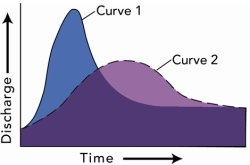
A) the basin for curve 1 has steeper slopes than the basin for curve 2
B) the storm recorded by curve 1 was shorter and more intense than the storm represented by curve 2
C) curve 1 shows the same area as curve 2 but after urbanization
D) all of these are possible
Correct Answer:

Verified
Correct Answer:
Verified
Q28: Which of the following is NOT associated
Q65: What happens to water velocity downstream? It
Q66: Based on the accompanying hydrograph,what was the
Q66: If a stream drops 15 meters in
Q68: On this graph of discharge versus season
Q69: In this landscape,choose the location that you
Q72: What is the pattern of discharge shown
Q73: In the accompanying hydrograph for major river,a
Q74: Using this plot of annual peak discharge,what
Q75: Construction of a dam results in: <img