Multiple Choice
Consider this graph modelling the influence of an intervention on company financial performance. What is shown in the graph?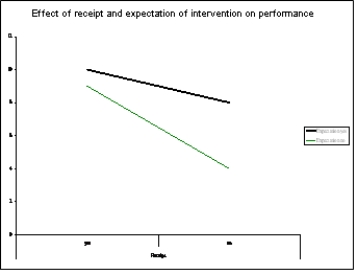
A) There is an interaction and no main effects.
B) There is one main effect and no interaction.
C) There are two main effects and no interaction.
D) There is an interaction and two main effects.
Correct Answer:

Verified
Correct Answer:
Verified
Q3: Breaking down the total variance is referred
Q4: Research was conducted in which employees were
Q5: An experiment was conducted to look at
Q6: Which of the following questions should not
Q7: What value should appear where YYY appears?<br>A)
Q9: Which procedure would not have been suitable
Q10: Consider the table below, which displays data
Q11: In the same context as Q4, consider
Q12: What would the substantive interpretation of this
Q13: In a factorial design with two factors