Multiple Choice
Consider the graph below. This shows the results of an experiment training condition as the independent variable and employee IQ as the covariate.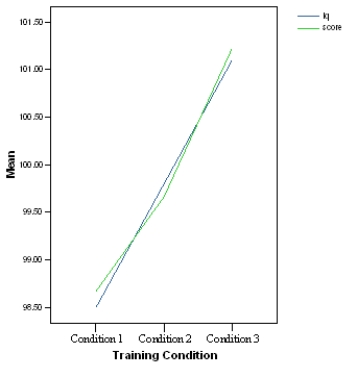
What does the graph indicate?
A) Although the independent variable has had an effect on the dependent variable, the covariate is the more likely explanation of effect.
B) The training condition has altered IQ.
C) IQ has altered learning condition.
D) Not enough information.
Correct Answer:

Verified
Correct Answer:
Verified
Q6: An HR manager had noticed that some
Q7: The second part of SPSS output for
Q8: The first part of the SPSS output
Q9: What type of analysis might you choose
Q10: What assumption does ANCOVA have that ANOVA
Q11: Using the SPSS output in Q4, which
Q12: What is not true of the ANCOVA
Q13: In an ANCOVA with one covariate and
Q14: Which of these statements is not true
Q16: In an experiment to study the effectiveness