Multiple Choice
An experiment was done to look at whether there is an effect of the number of hours spent practising a musical instrument and gender on the level of musical ability. A sample of 30 (15 men and 15 women) participants who had never learnt to play a musical instrument before were recruited. Participants were randomly allocated to one of three groups that varied in the number of hours they would spend practising every day for 1 year (0 hours, 1 hours, 2 hours) . Men and women were divided equally across groups. All participants had a one-hour lesson each week over the course of the year, after which their level of musical skill was measured on a 10-point scale ranging from 0 (you can't play for toffee) to 10 ('Are you Mozart reincarnated?') .
-An ANOVA was conducted on the data from the experiment. Which of the following sentences best describes the pattern of results shown in the graph? 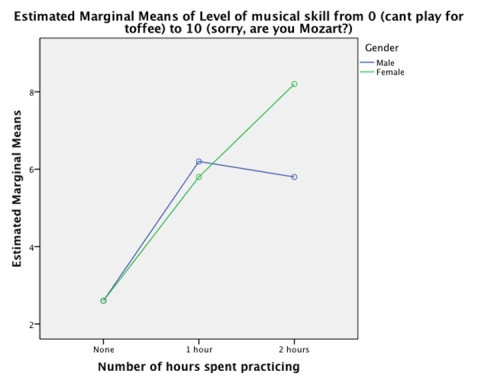
A) The graph indicates that men and women were most musically skilled when they practised for 2 hours per day.
B) Women were more musically skilled than men.
C) The graph shows that the relationship between musical skill and time spent practising was different for men and women.
D) The graph shows that the relationship between musical skill and time spent practising was the same for men and women.
Correct Answer:

Verified
Correct Answer:
Verified
Q6: An experiment was done to look at
Q7: What is the Interaction effect in an
Q8: A medical researcher wanted to test and
Q9: An experiment was done to look at
Q10: study was conducted to look at
Q12: An experiment was done to look at
Q13: When interpreting F(3, 26) = 12.66, p
Q14: What type of ANOVA is used when
Q15: study was conducted to look at whether
Q16: Which of the following sentences is correct?<br>A)Main