Multiple Choice
What does the graph below indicate about the normality of our data? 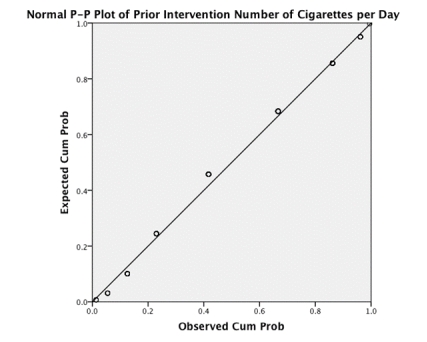
A) We cannot infer anything about the normality of our data from this type of graph.
B) The P-P plot reveals that the data deviate mildly from normal.
C) The P-P plot reveals that the data are normal.
D) The P-P plot reveals that the data deviate substantially from normal.
Correct Answer:

Verified
Correct Answer:
Verified
Q22: When we talk about the assumption of
Q23: In a small data sample (N =
Q24: A _ is a numerical characteristic of
Q25: A researcher investigating 'Pygmalion in the classroom'
Q26: To get a sample of a certain
Q27: Which of the following is not an
Q28: The assumption of homogeneity of variance is
Q29: What does the graph below indicate about
Q31: Looking at the table below, which of
Q32: When it is not necessary to use