Short Answer
What does the following graph illustrate? (PD is peritoneal dialysis.) 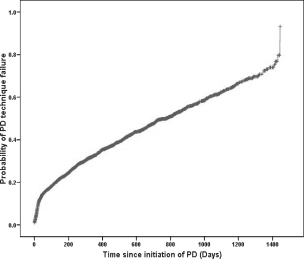
Correct Answer:

Verified
Correct Answer:
Verified
Related Questions
Q9: Which of the following is not used
Q10: Collinearity diagnostics can be used for what
Q10: How would you request a logistic regression
Q11: Which of the following is not an
Q14: What does the Wald statistic represent?<br>A) The
Q15: With conventional coding in logistic regression of
Q16: In the above example, the mean is
Q17: The odds ratio is?<br>A) The natural log
Q17: A researcher was interested in predicting whether
Q18: Which of the following statements is not