Multiple Choice
Consider the graph below. This is the graph of the results of an experimental learning condition as the independent variable and IQ as the covariate. What does the graph indicate? 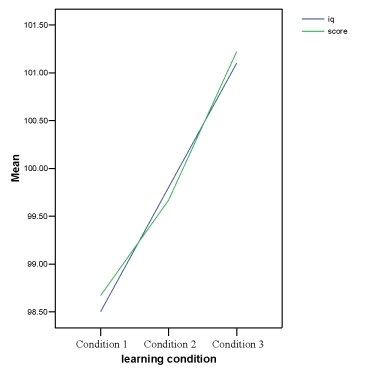
A) Although the independent variable has had an effect on the dependent variable, the covariate is the more likely explanation of effect.
B) The learning condition has altered IQ.
C) IQ has altered the learning condition.
D) Not enough information.
Correct Answer:

Verified
Correct Answer:
Verified
Q1: Which of the following is not considered
Q2: A music teacher had noticed that some
Q3: To 'partial out' means to?<br>A) Examine the
Q4: A music teacher had noticed that some
Q6: The following scatterplot represents the results of
Q7: What makes ANCOVA different from ANOVA?<br>A) ANCOVA
Q8: A scatterplot and a summary table for
Q9: What is not true of the ANCOVA
Q10: When assumptions are violated in ANCOVA, which
Q11: A health psychologist was interested in the