Multiple Choice
What does the relationship of the data in the following scatterplot indicate? 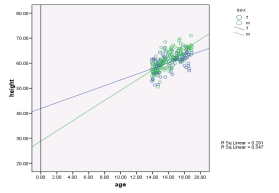
A) A positive relationship where height increases with age for both sexes
B) A larger relationship for males
C) A negative relationship for both sexes
D) None of the above
Correct Answer:

Verified
Correct Answer:
Verified
Related Questions
Q10: What assumption does ANCOVA have that ANOVA
Q15: What is an alternative way to model
Q16: A music teacher had noticed that some
Q17: What does ANCOVA allow the researcher to
Q19: Adjusted group means are<br>A) Means across all
Q20: What does the effect size measure in
Q21: In an experiment to study the effectiveness
Q23: A music teacher had noticed that some
Q24: In a study of favourable effects of
Q25: Under what circumstances would you not consider