Multiple Choice
The following scatterplot represents the results of a study undertaken by Chakrabarty et al. (2005) who were investigating glutamate levels in psychotropic drug-naive OCD patients and comparing them with psychiatrically normal controls. Findings were reported as follows for CSF glutamate levels in OCD patients compared to controls: F(1,29) =11.153, p = 0.002. How would these findings be interpreted? 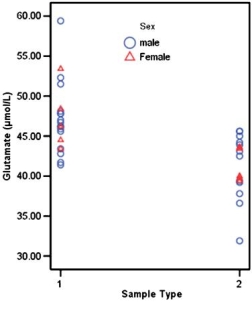 Scatterplot showing CSF glutamate levels in patients (1) and controls (2) .
A) CSF glutamate levels are not significantly raised in OCD patients compared to normal controls.
B) CSF glutamate levels are significantly raised in OCD patients compared to normal controls.
C) CSF glutamate levels are unchanged in OCD patients compared to normal controls.
D) None of the above.
Correct Answer:

Verified
Correct Answer:
Verified
Q7: What makes ANCOVA different from ANOVA?<br>A) ANCOVA
Q8: A scatterplot and a summary table for
Q9: What is not true of the ANCOVA
Q10: When assumptions are violated in ANCOVA, which
Q11: A health psychologist was interested in the
Q13: In an ANCOVA with one covariate and
Q14: Using the SPSS output below, which of
Q15: What is an alternative way to model
Q16: A music teacher had noticed that some
Q17: What does ANCOVA allow the researcher to