Multiple Choice
Examine the following Q-Q plot from the pre-test control group. What can be assumed from the graph? 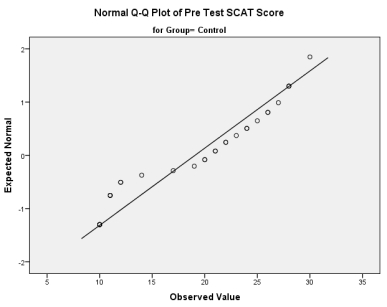
A) Data may not be normally distributed because the points deviate from the diagonal line.
B) Data are definitely not normally distributed because the points deviate from the diagonal line.
C) Data may be normally distributed because the points deviate from the diagonal line.
D) Data are definitely normally distributed because the points deviate from the diagonal line.
Correct Answer:

Verified
Correct Answer:
Verified
Q3: Which test can be considered the non-parametric
Q3: Which test can be considered the non-parametric
Q4: Since there are three sets of data,
Q5: Examine the following Q-Q plot from the
Q7: Calculate the effect size for the test
Q9: Where were differences between the data sets?
Q11: Which of the following descriptions best explains
Q22: If we wanted to compare the control
Q34: Run an appropriate test between the pre-test
Q45: Which is the correct expression for the