Multiple Choice
Plot resting diastolic blood pressure as a histogram. You should get the histogram below. How would you describe its appearance? 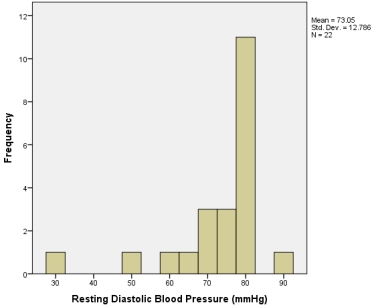
A) Normally distributed
B) Positively skewed
C) Negatively skewed
D) None of the descriptions represent the data expressed in the histogram
Correct Answer:

Verified
Correct Answer:
Verified
Related Questions
Q15: Which of the following statements best describes
Q16: Statistical bias can affect which of the
Q17: Compare the MAP variance of the three
Q18: Which of the following descriptions refers to
Q19: What does the X in Q1 refer
Q20: Which of the following does Hartley's F<sub>max</sub>
Q21: Based on the results for the skewness
Q23: Use the compute function to create a
Q24: Calculate the z-score for the skewness of
Q25: Split the data according to the sport.