Multiple Choice
Plot the FEV1 data presented in Q11 as a scatterplot. You should get the scatterplot shown below. Inspecting the scatterplot, what is the r-value for the line of best fit? 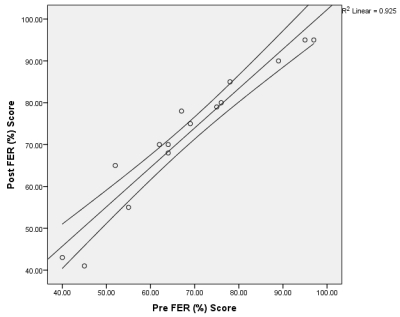
A) .96
B) .94
C) .93
D) .92
Correct Answer:

Verified
Correct Answer:
Verified
Related Questions
Q11: Why is it necessary to present numerical
Q12: Calculate the mean and standard deviation of
Q13: Normally distributed data are normally referred to
Q14: Which of the following are important components
Q15: The interquartile range represents how many percentiles?<br>A)
Q17: If you were to graphically present the
Q18: A researcher randomized 75 children into three
Q19: The graph presented below represents the post-test
Q20: Which measure of data distribution is presented
Q21: Which axis is the independent variable usually