Multiple Choice
Analyse the following graph. The data shows the results of three groups of 15 athletes who were instructed to complete a basketball shooting exercise (success rate from 20 free throw shots) having received one of three methods of instruction, auditory (shooting technique being verbally described by a coach) , visual (shooting technique being verbally described by a coach) or kinaesthetic (no coaching, just asked to perform the shooting exercise) . Motivation acted as the covariate of interest. How would you describe the regression slopes? 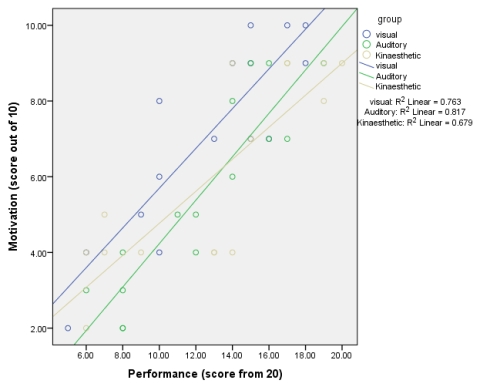
A) Positive and homogeneous
B) Positive and heterogeneous
C) Negative and homogeneous
D) Negative and heterogeneous
Correct Answer:

Verified
Correct Answer:
Verified
Q1: Eta squared is a measure of effect
Q2: Examine the table below. Based on the
Q3: Why might you wish to include covariates
Q5: Analyse the following data. What is the
Q6: How is eta squared calculated?<br>A) SS<sub>M</sub> /
Q7: If you were to analyse the effect
Q8: How would you express the results of
Q9: Run a one-way ANOVA on the covariate
Q10: Which of the following statements best describes
Q11: Based on the result in Q11, which