Essay
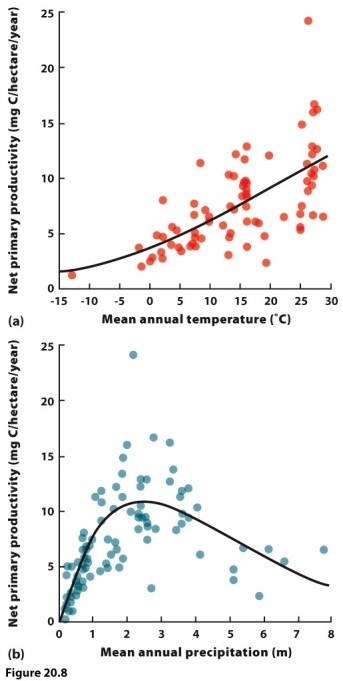
(Figure 20.8) The figure shows that as mean annual temperature increases, net primary productivity also increases. Net primary productivity increases with mean annual precipitation until approximately 3 metres of precipitation, after which productivity declines. Why does this decline occur?
Correct Answer:

Verified
After about 3 metres of annual precipita...View Answer
Unlock this answer now
Get Access to more Verified Answers free of charge
Correct Answer:
Verified
View Answer
Unlock this answer now
Get Access to more Verified Answers free of charge
Q3: Net production energy divided by assimilation energy
Q7: Silicon is used primarily by<br>A) zooxanthellae.<br>B) zooplankton.<br>C)
Q9: Which of the following is NOT a
Q12: The rate at which solar or chemical
Q16: The _ the residence time, the _
Q38: Standing crop is determined by _ productivity.<br>A)
Q43: Ecological efficiency is also called _ efficiency.<br>A)
Q61: Which of the following factors is NOT
Q63: Experiments on how soil fertility limits terrestrial
Q67: In which ecosystem does leaf litter have