Multiple Choice
Use Figure 18.10a for MC questions 20 - 22.
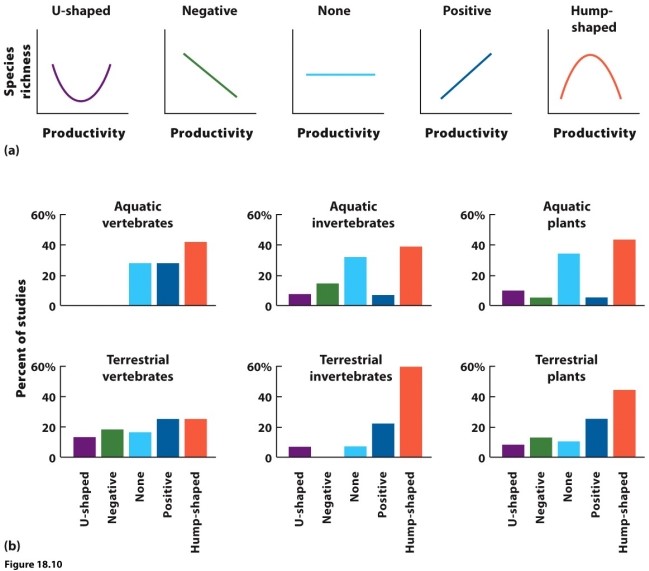
-Which curve suggests that species richness is controlled by bottom-up factors?
A) U-shaped
B) negative
C) none
D) positive
E) hump-shaped
Correct Answer:

Verified
Correct Answer:
Verified
Related Questions
Q2: What organisms in the figure appear NOT
Q3: Based on examples from the chapter, do
Q9: Use the figure to answer questions 4
Q12: Use the following figure for questions 24
Q31: What is the relation between habitat diversity
Q39: What population trait allows a species to
Q50: When Hairston, Smith, and Slobodkin suggested that
Q52: What is a major distinction between direct
Q57: Hairston, Smith, and Slobodkin suggested that Earth
Q62: Which relationships in the figure indicate top-down