Essay
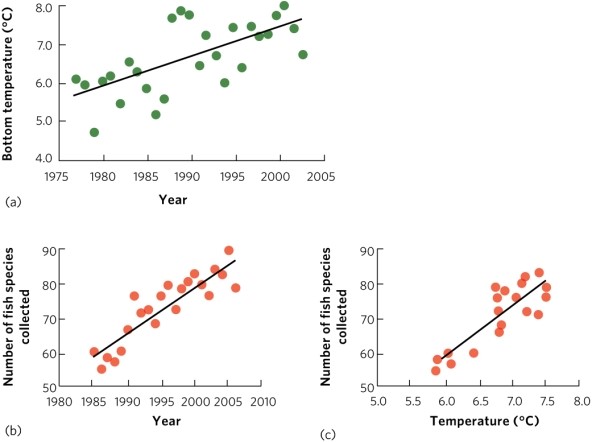
(Figure 11.5) Researchers examined data collected between 1985 and 2006 on diversity of fish in the North Sea, average bottom temperatures, and how species diversity was affected by temperature. According to the figure, what did they find? What did they conclude about the cause of the change in fish diversity?
Correct Answer:

Verified
Over this period of increasing bottom-wa...View Answer
Unlock this answer now
Get Access to more Verified Answers free of charge
Correct Answer:
Verified
View Answer
Unlock this answer now
Get Access to more Verified Answers free of charge
Q11: <img src="https://d2lvgg3v3hfg70.cloudfront.net/TB5501/.jpg" alt=" (Figure 11.14)
Q12: A researcher counts the number of individuals
Q13: Methods such as area-based, volume-based, and line-transect
Q22: Scientists commonly use _ dispersal distance to
Q23: When individuals have perfect knowledge of habitat
Q33: How do dispersal and migration differ?<br>A) Dispersal
Q39: Which of the following does NOT explain
Q48: Which population model applies to the situation
Q51: In populations that fit a source-sink metapopulation
Q68: What type of dispersion do many agricultural