Multiple Choice
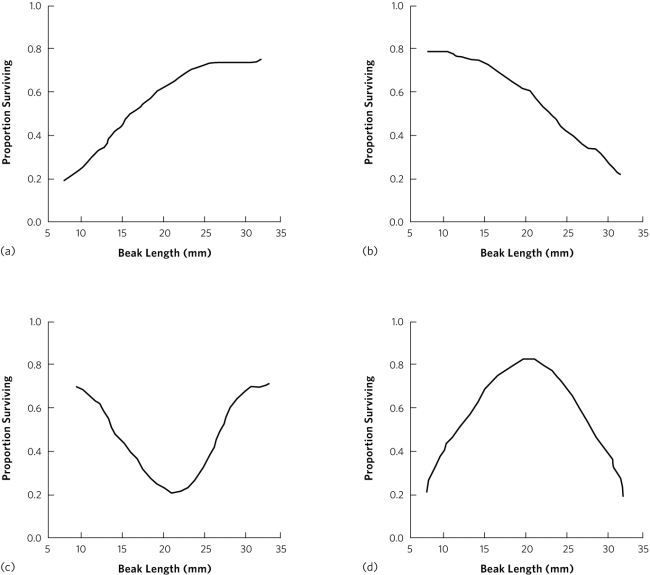 The four plots in the figure show possible relationships between the survival and beak length in an island population of birds. Which plot is an example of disruptive selection?
A) plot a
B) plot b
C) plot c
D) plot d
Correct Answer:

Verified
Correct Answer:
Verified
Related Questions
Q11: Explain how a diversity of habitats combined
Q19: Darwin supported his argument for evolution by
Q22: Which of the following is a component
Q25: Many genetic diseases have severe or lethal
Q39: Which of the following statements about evolution
Q40: Consider a gene that affects fur colour
Q43: <img src="https://d2lvgg3v3hfg70.cloudfront.net/TB5501/.jpg" alt=" You conduct
Q45: Evolution by artificial selection is similar to
Q47: If a population of butterflies is under
Q48: A small species of fly lays its