Multiple Choice
NARRBEGIN: Exhibit 5-23
Exhibit 5-23
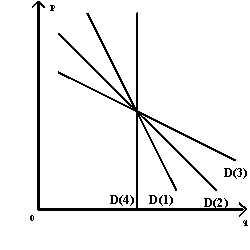
-Refer to Exhibit 5-23. The demand curve that best illustrates how consumers will respond to a change in price over a very long time period is:
A) curve D(1)
B) curve D(2)
C) curve D(4)
D) curve D(3)
E) either curve D(1) or D(4)
Correct Answer:

Verified
Correct Answer:
Verified
Q32: A normal good is defined as a
Q53: Exhibit 5-9 <img src="https://d2lvgg3v3hfg70.cloudfront.net/TB4915/.jpg" alt="Exhibit 5-9
Q79: If the demand for a product is
Q139: Along a downward-sloping linear demand curve,<br>A)slope is
Q140: If the demand curve shifts but the
Q144: If the price of Pepsi-Cola increases from
Q179: NARRBEGIN: Exhibit 5-20<br>Exhibit 5-20<br> <img src="https://d2lvgg3v3hfg70.cloudfront.net/TB4908/.jpg" alt="NARRBEGIN:
Q184: For which of the following is demand
Q198: Exhibit 5-2<br> <img src="https://d2lvgg3v3hfg70.cloudfront.net/TB4915/.jpg" alt="Exhibit 5-2
Q211: If demand is inelastic, the percentage change