Essay
Figures A and B show the effect of a late- and an early acting mutation on the lifetime fitness of individuals. Reproduction begins at day 30. Using the graphs, how would you determine which of the two mutations had a greater effect on lifetime fitness? 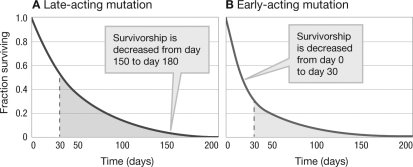
Correct Answer:

Verified
Lifetime reproductive success is shown b...View Answer
Unlock this answer now
Get Access to more Verified Answers free of charge
Correct Answer:
Verified
View Answer
Unlock this answer now
Get Access to more Verified Answers free of charge
Q19: Which of the following hypothetical viruses would
Q20: In the survivorship curve shown in the
Q21: Name three methods that pathogens use to
Q22: All of the following are evolved immune
Q23: What is the likely phylogenetic explanation for
Q25: Which of the following strategies allows vertebrate
Q26: Which of the two viral phylogenies below
Q27: This figure shows the basal and fever
Q28: Consider Niko Tinbergen's four levels of explanation
Q29: How can age-specific antagonistic pleiotropy account for