Multiple Choice
The figure shown illustrates the proportion of a particular asexual snail clone in a population and the degree to which it was infected with a particular parasite. Which prediction of the Red Queen hypothesis do these results appear to reflect? 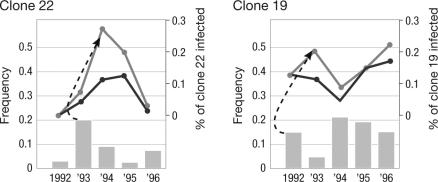
A) a correlation between parasite load and sexual reproduction
B) oscillation in the relative frequency of asexual strains in the presence of parasites
C) emergent host defenses synchronously tracked by parasite responses
D) a general decline of asexual lineages in the presence of parasites
Correct Answer:

Verified
Correct Answer:
Verified
Q9: In an experiment, Jokela and colleagues reared
Q10: Morphological or behavioral characteristics used to attract
Q11: The Amazon molly, Poecillia formosa, is a
Q12: Birds of paradise are a family of
Q13: Explain how sexual reproduction overcomes the inherent
Q15: In the crustacean genus Hyalella, females mate
Q16: Develop a short hypothetical explanation (one sentence)
Q17: How could the number of gametes produced
Q18: Why do pathogens tend to evolve faster
Q19: According to the reasoning of John Maynard