Multiple Choice
The graph shows the extinction rates for families of marine organisms over different periods of Earth's history. What is the best estimate for the background extinction rate given these data? 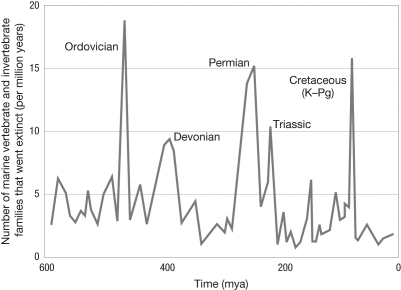
A) 14-20 families per million years
B) 8-12 families per million years
C) 2-5 families per million years
D) 2-20 families per million years
Correct Answer:

Verified
Correct Answer:
Verified
Q31: You are a paleontologist studying the fossil
Q32: The K-Pg extinction was likely the result
Q33: For much of the Cretaceous, bivalves belonging
Q34: Where would you place the actual extinction
Q35: Why do paleontologists find many more fossils
Q37: Native plant A is endangered. You suspect
Q38: The figure below shows the increasing morphological
Q39: What effect of mass extinctions is described
Q40: Alison Boyer (2008) analyzed data on the
Q41: How did the cause(s) of the K-Pg