Multiple Choice
The graph shows extinction rates for families of marine organisms during different periods of Earth's history. How many mass extinction events do scientists commonly infer from these data? 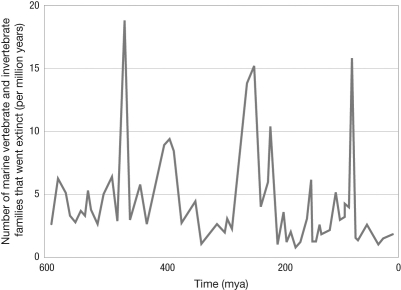
A) 2
B) 13
C) 5
D) 3
Correct Answer:

Verified
Correct Answer:
Verified
Related Questions
Q1: The probability of extinction via predation is
Q2: Elevated levels of iridium are found in
Q3: Why was the near extinction of all
Q4: Explain how the figure suggests that extinction
Q6: Based on the fossil record, it was
Q7: As a refuge manager for the US
Q8: A paleontologist collected fossils in the
Q9: Extinction of a species means that<br>A) all
Q10: Explain how forward smearing can result in
Q11: What two evolutionary processes result in an