Multiple Choice
The figure shows the Ka /Ks values for two regulatory genes in pairs of species in (A) North American tarweeds and (B) Hawaiian silverswords. The dashed lines are the mean Ka/Ks values. What do these data indicate about how these genes are evolving differently in these two groups of taxa? A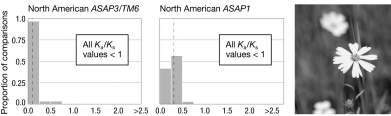
B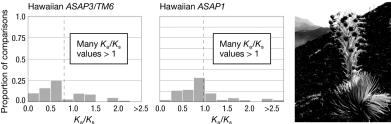
A) They are evolving neutrally in the tarweeds and under purifying selection in the silverswords.
B) There have been more mutations in this gene in the silverswords than the tarweeds.
C) They have experienced purifying selection in the tarweeds and positive selection in the silverswords.
D) They have undergone gene conversion in the tarweeds but not in the silverswords.
Correct Answer:

Verified
Correct Answer:
Verified
Q40: When both mutation and genetic drift are
Q41: The molecular clock has limited usefulness for
Q42: K<sub>a</sub> measures the rate of nonsynonymous substitutions.
Q43: Genetic drift causes changes in<br>A) the strength
Q44: F-statistics can be used to quantify the
Q45: In a population of mice there are
Q47: Imagine that, of three species, it is
Q48: Consider a population of 10,000 pigeons founded
Q49: If we trace the genealogies of two
Q50: The figure shows aligned homologous gene sequences