Multiple Choice
The graph shows the relationship between the number of surviving gray wolf pups in a litter and the inbreeding coefficient of those pups. What do these data reveal about the types of alleles present in this population? 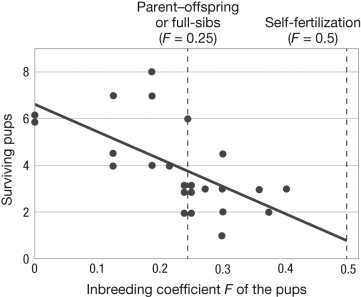
A) There are recessive deleterious alleles present.
B) The population is in Hardy-Weinberg equilibrium.
C) The rate of mutation is very high.
D) Mating is nonrandom with respect to genotype.
Correct Answer:

Verified
Correct Answer:
Verified
Q1: Under mutation-selection balance, even if an allele
Q2: Stalk height in sunflowers is determined by
Q3: The table shows the survival and seed
Q5: The figure shows the allele frequency trajectories
Q6: Why do you need to use a
Q7: Inbreeding increases the frequency of _ in
Q8: Which of the following is a consequence
Q9: Considering any field of science, why is
Q10: The null model for population genetics is<br>A)
Q11: What does it mean for two alleles