Multiple Choice
The figure shown is a phylogeny created with DNA sequence data and has high bootstrap support values. The tree also includes observed phenotypes (in varying shades of gray) for the five taxa. The character states are indicated by "B" or "b," "G" or "g," and "P" or "p." Evaluate the hypothetical phylogenetic tree using a parsimony approach. For which of the following taxa were there the FEWEST state changes if the inferred ancestral state was "bGP"? 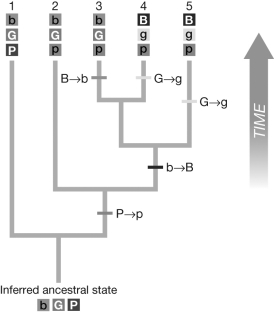
A) Taxon 2
B) Taxon 3
C) Taxon 4
D) Taxon 5
Correct Answer:

Verified
Correct Answer:
Verified
Q36: The older a clade is, the<br>A) more
Q37: Does the Fitch algorithm indicate the most
Q38: The figure shown is a phylogeny created
Q39: Most computer programs for reconstructing large phylogenies<br>A)
Q40: Which of the following is an advantage
Q41: If the two sister species on the
Q42: One of the principle ways to understand
Q44: Bootstrap resampling<br>A) can be used with any
Q45: Describe how fossils of Tiktaalik roseae discovered
Q46: The figure shows six pairwise genetic distances