Multiple Choice
The figure shows a hypothetical relationship between the growth rates of E. coli at 37 and 42 degrees Celsius. This figure illustrates what type of evolutionary constraint? 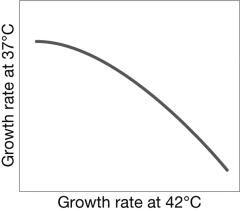
A) Physical constraints make it difficult for natural selection to produce E. coli that are successful at 42 degrees.
B) It illustrates the lack of repeatability in evolution.
C) Alleles that are beneficial in one environment may be deleterious in another environment.
D) Changing environments make it impossible for natural selection to act.
Correct Answer:

Verified
Correct Answer:
Verified
Q20: The figure shows the norm of reaction
Q21: Based on the figure, use phylogenetic reasoning
Q22: Imagine you are an evolutionary biologist studying
Q23: Give an example of a trait that
Q24: Organisms may not be perfectly adapted to
Q26: An exaptation is a trait<br>A) originally selected
Q27: How can gene duplication provide an evolutionary
Q28: The eyes of an owl are positioned
Q29: Fitness differences among laboratory populations of E.
Q30: Spines, flowers, and a waxy stem coating