Multiple Choice
In a study of the relationship between amount of sugar consumed (X) and excitability (Y) in children,the regression equation was calculated to be 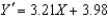 .The amount of sugar consumed ranged from 1 to 4 ounces.Which of the following graphs correctly displays the regression line?
A) Graph A
B) Graph B
C) Graph C
D) Graph D
Correct Answer:

Verified
Correct Answer:
Verified
Q3: Compared to a strong relationship,a weak relationship
Q4: Computing the standard error of the estimate
Q5: What is the slope of the following
Q6: The standard error of the estimate is
Q7: A nutrition major at State University was
Q9: In the regression equation,the slope summarizes _
Q10: What is the Y-intercept of the following
Q11: A regression line is used to obtain<br>A)the
Q12: Which of the following formulas represents the
Q13: When we divide the error remaining after