Multiple Choice
What kind of relationship is depicted in the following graph? 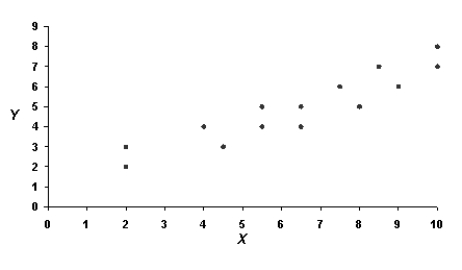
A) A positive linear correlation
B) A negative linear correlation
C) No correlation
D) A nonlinear correlation
Correct Answer:

Verified
Correct Answer:
Verified
Q24: In a study about the relationship between
Q25: Professor Miller has found that the correlation
Q26: Which correlation coefficient should we use if
Q27: Calculate the appropriate correlation coefficient for the
Q28: What statistic should be used to find
Q30: What type of relationship does the following
Q31: If you see the notation <img src="https://d2lvgg3v3hfg70.cloudfront.net/TB4035/.jpg"
Q32: When the correlation coefficient representing the relationship
Q33: Suppose a researcher has trained two observers
Q34: What does a correlation coefficient do?<br>A)It allows