Multiple Choice
What kind of relationship is depicted in the following graph? 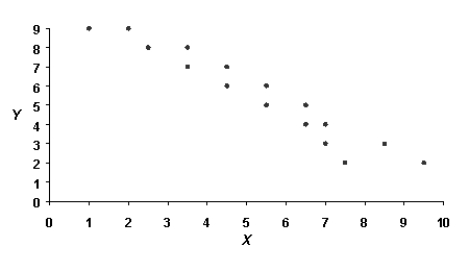
A) A positive linear correlation
B) A negative linear correlation
C) No correlation
D) A nonlinear correlation
Correct Answer:

Verified
Correct Answer:
Verified
Related Questions
Q35: Which relationship is stronger,r = +0.62 or
Q36: Which of the following studies represents the
Q37: "The self-confidence of a group of students
Q38: If we compute a correlation on data
Q39: What statistic should be used to find
Q41: Professor Johnston has found a strong positive
Q42: What statistic should be used to find
Q43: In general,a zero correlation means that<br>A)as the
Q44: Professor Helgin has found that the correlation
Q45: We should do a scatterplot of the