Multiple Choice
The following graphs display the data points for two linear correlations.Based on the information provided in these graphs,________ displays a negative correlation and ________ displays a stronger correlation. 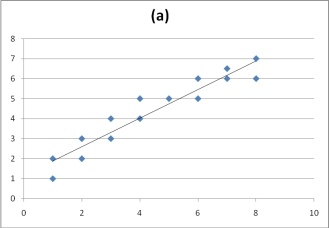
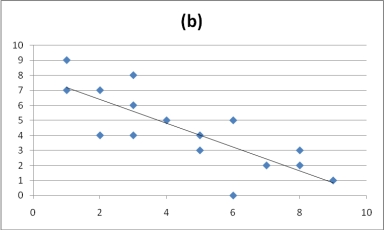
A) Graph A;Graph B
B) Graph B;Graph A
C) Graph A;Graph A
D) Graph B;Graph B
Correct Answer:

Verified
Correct Answer:
Verified
Q7: A researcher measures the correlation of the
Q8: A correlation of r = .50 in
Q10: A researcher measures the relationship between narcissism
Q16: The correlation coefficient measures the extent to
Q23: The correlation coefficient ranges between _
Q23: The normality assumption states that the population
Q42: A researcher measures the following correlation between
Q45: The correlation coefficient can be converted to
Q74: To summarize correlations,we report the strength,the direction,and
Q77: The phi correlation coefficient is a measure