Multiple Choice
State the type of graphical display for Graph A and Graph B. 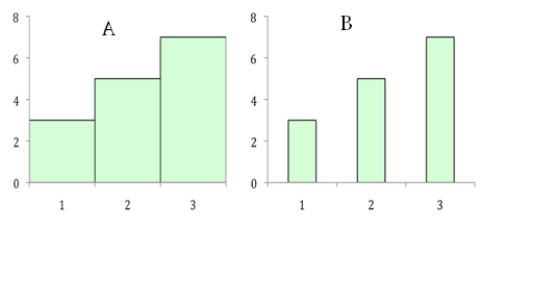
A) A is a bar chart;B is a histogram.
B) B is a bar chart;A is a histogram.
C) Both graphs are bar charts.
D) Both graphs are histograms.
Correct Answer:

Verified
Correct Answer:
Verified
Related Questions
Q9: Grouped data are to ungrouped data as<br>A)quantitative
Q17: Fill in the missing values for A
Q18: A researcher measures the time (in seconds)that
Q23: Which of the following is a type
Q25: A relative frequency distribution is appropriate when<br>A)
Q40: The percentile rank of a score is
Q58: A percentile is also called a:<br>A) score.<br>B)
Q66: In a bar chart,each class or category
Q67: When cumulating frequencies from the top down,the
Q72: A histogram is used to summarize grouped