Multiple Choice
The figure shows a standard normal N(0,1) distribution.Find the shaded area. 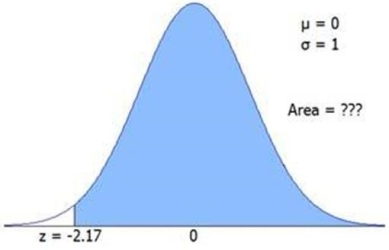
A) 0.6444
B) 0.7514
C) 0.9245
D) 0.9850
Correct Answer:

Verified
Correct Answer:
Verified
Related Questions
Q19: There is a simple formula for normal
Q33: The probability that a rental car will
Q37: If GMAT scores for applicants at Oxnard
Q41: Which is the correct Excel formula for
Q51: What are the mean and standard deviation
Q61: For a continuous random variable, the total
Q63: The time required for a citizen to
Q66: Compared to the area between z =
Q96: The area under the normal curve between
Q99: Experience suggests that 4 percent of all