Multiple Choice
The figure shows a standard normal N(0,1) distribution.Find the shaded area. 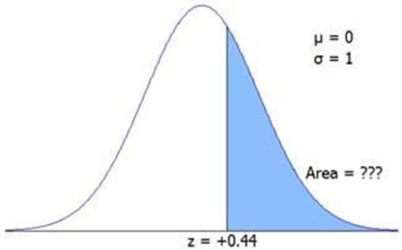
A) 0.4400
B) 0.3300
C) 0.2998
D) 0.2502
Correct Answer:

Verified
Correct Answer:
Verified
Related Questions
Q2: If the random variable Z has a
Q18: In a True-False exam with 100 questions,passing
Q19: If arrivals occur at a mean rate
Q23: If the mean time between in-flight aircraft
Q29: The mean, median, and mode of a
Q30: If the mean waiting time for the
Q72: A student's grade on an examination was
Q97: The number of lightning strikes in a
Q103: A machine dispenses water into a glass.
Q109: The exponential distribution can be either right-skewed