Multiple Choice
The figure shows a standard normal N(0,1) distribution.Find the z value for the shaded area. 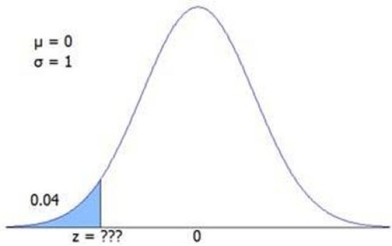
A) −1.98
B) −1.87
C) −1.75
D) −1.62
Correct Answer:

Verified
Correct Answer:
Verified
Related Questions
Q19: There is a simple formula for normal
Q23: If the mean time between in-flight aircraft
Q29: The mean, median, and mode of a
Q29: If arrivals occur at a mean rate
Q30: If the mean waiting time for the
Q33: The probability that a rental car will
Q51: What are the mean and standard deviation
Q72: A student's grade on an examination was
Q75: The normal distribution is a good approximation
Q97: The number of lightning strikes in a