Multiple Choice
The figure shows a standard normal N(0,1) distribution.Find the z value for the shaded area. 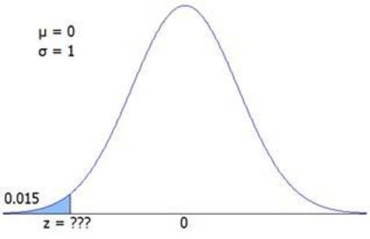
A) −2.17
B) −2.09
C) −1.99
D) −1.94
Correct Answer:

Verified
Correct Answer:
Verified
Related Questions
Q21: A company employs 300 employees. Each year,
Q34: Which probability model is most appropriate to
Q54: The exponential distribution is always skewed right.
Q67: A random variable X is best described
Q68: If arrivals occur at a mean rate
Q69: The standard deviation of a normal random
Q70: A large number of applicants for admission
Q72: Could this function be a PDF? <img
Q75: The Excel function = 800*RAND()would generate random
Q88: In a continuous distribution the<br>A)PDF is usually