Multiple Choice
The figure shows a normal N(400,23) distribution.Find the approximate shaded area. 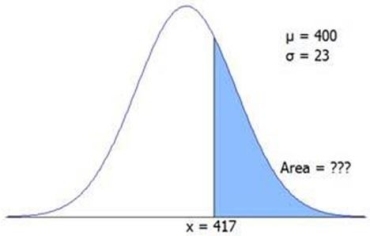
A) 0.3811
B) 0.3527
C) 0.2299
D) 0.1940
Correct Answer:

Verified
Correct Answer:
Verified
Related Questions
Q16: Any two normal curves are the same
Q20: For which binomial distribution would a normal
Q70: The normal is a good approximation to
Q84: A random variable X is best described
Q104: If the random variable Z has a
Q108: If the mean time between unscheduled maintenance
Q112: In Melanie's Styling Salon,the time to complete
Q113: Excel's = RAND()function produces random numbers that
Q114: Regarding continuous probability distributions,which statement is correct?<br>A)The
Q120: If the random variable Z has a